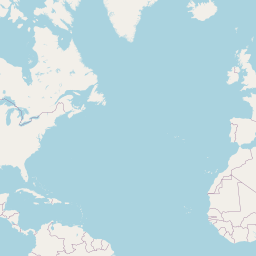
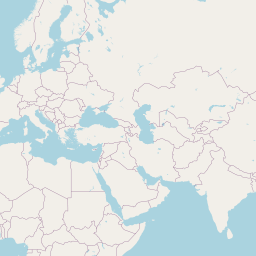
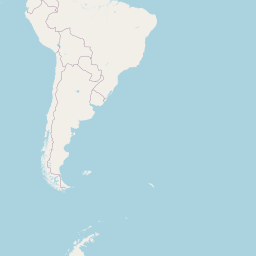
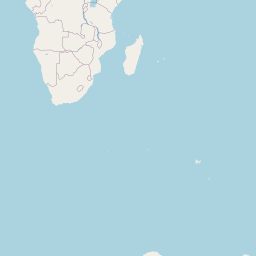
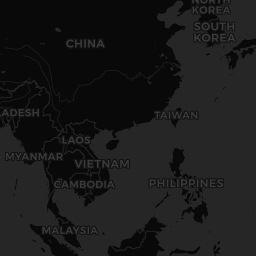
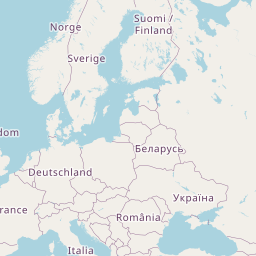
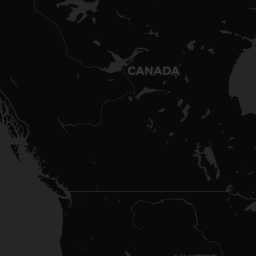
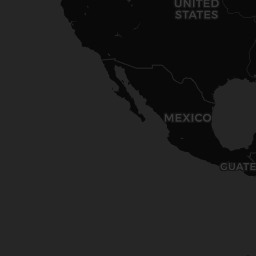
The Geospatial application provides interactive maps for visualizing location-based data, from demographic distributions to infrastructure networks. Analysts, urban planners, and researchers can overlay datasets onto maps to uncover spatial patterns invisible in spreadsheets.
Country and Region Comparison
Compare metrics across countries and regions side by side, with detailed modal views for each location. This is invaluable for market research, academic studies, and policy analysis where understanding geographic variation drives decision-making.
Predictive Analytics and Anomaly Detection
Leverage built-in predictive analytics modules to forecast trends and detect anomalies in geospatial data. Businesses can identify emerging markets, governments can spot infrastructure issues, and researchers can model climate or population changes.
Infrastructure and Asset Mapping
Map physical assets, infrastructure, and resources with custom data layers. Utility companies, logistics teams, and real estate professionals can visualize networks, plan routes, and assess coverage areas with precision and clarity.